Watch Video
">
 观看视频
观看视频
测量和消除数字电路中的时钟抖动
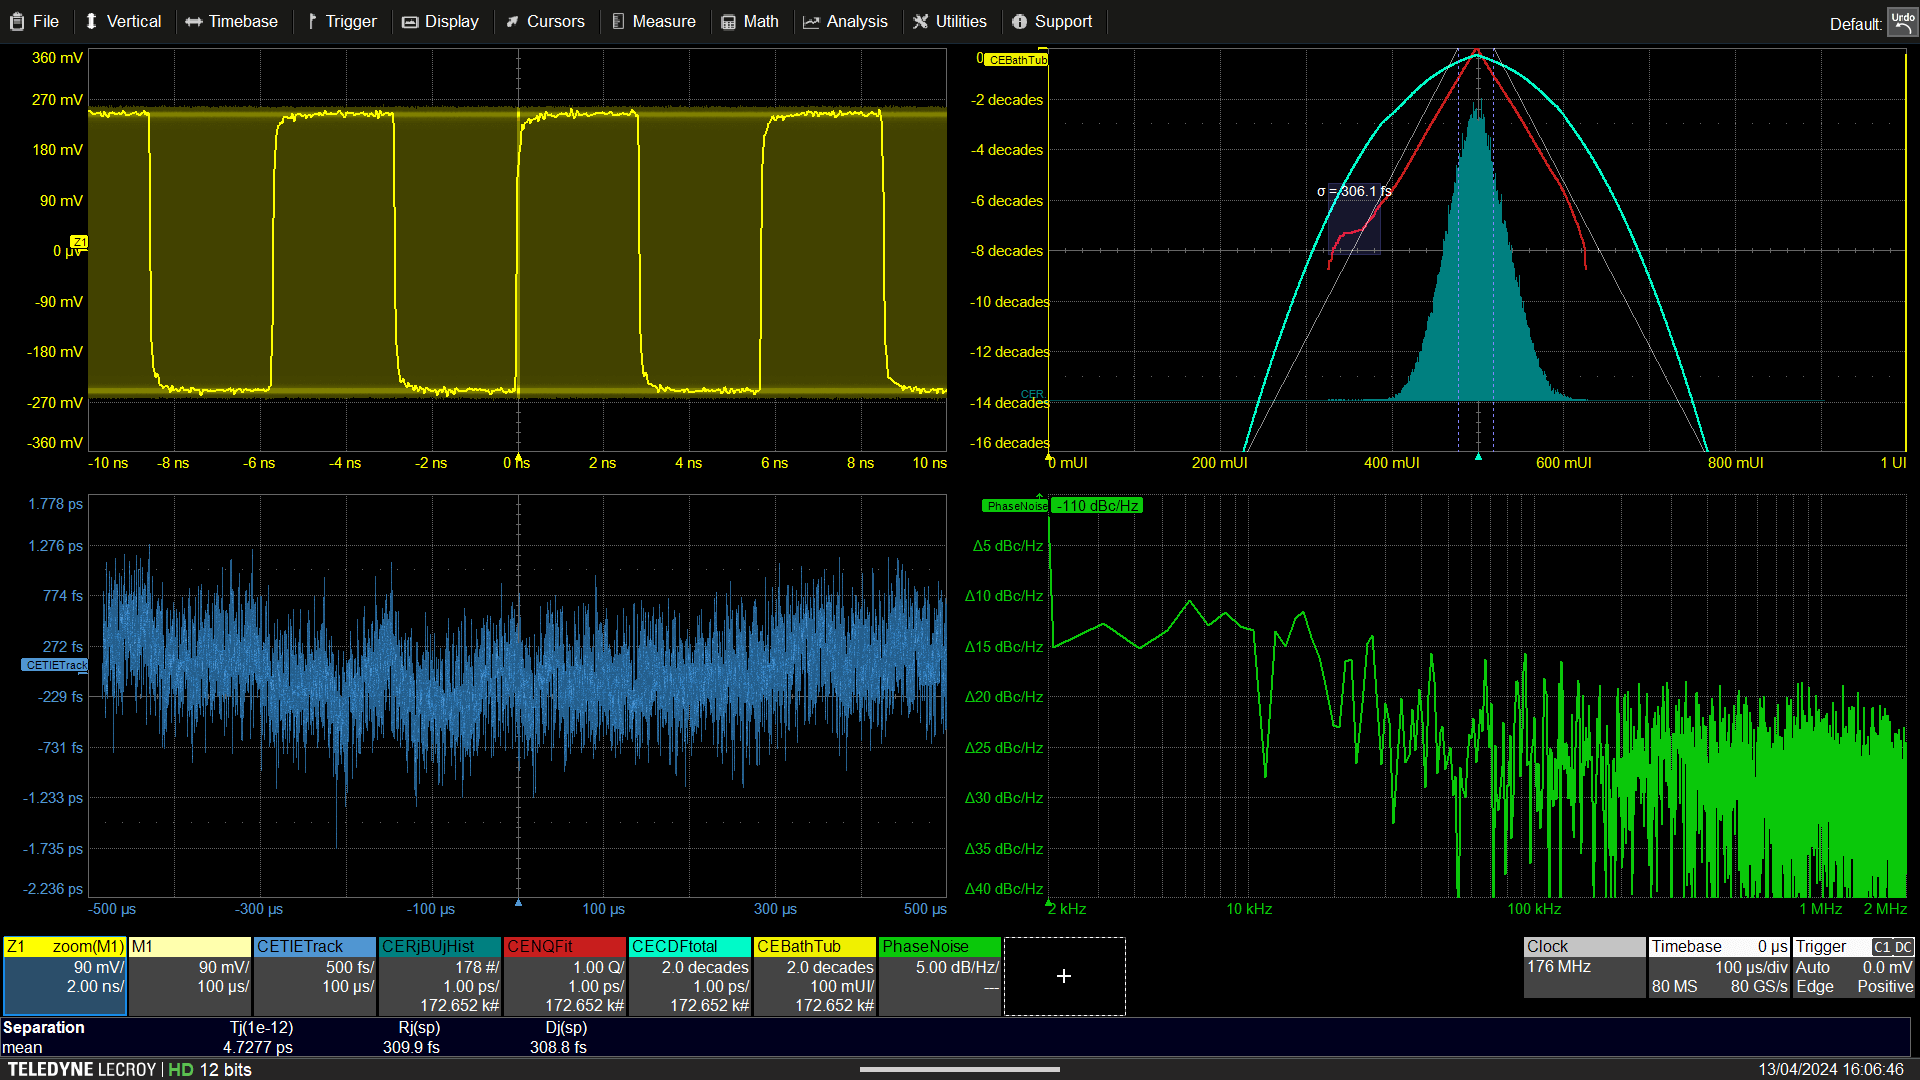
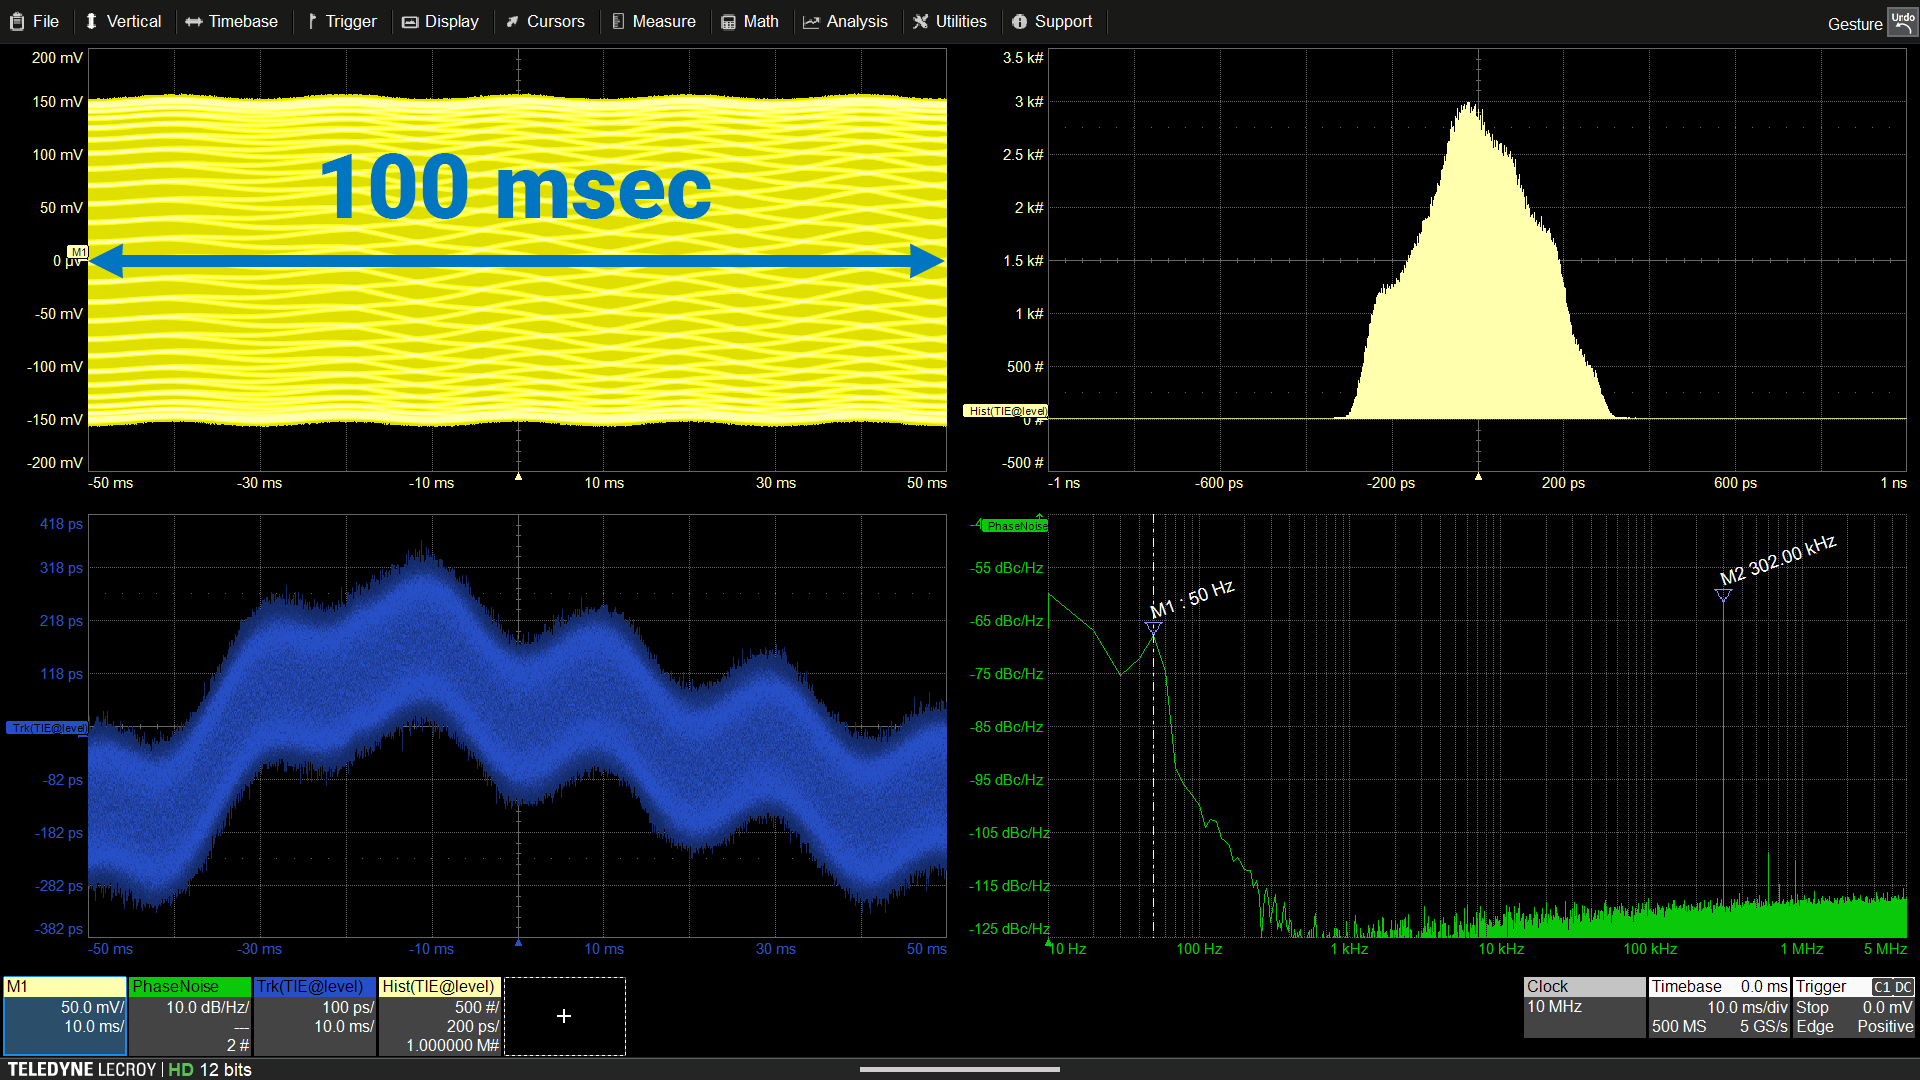
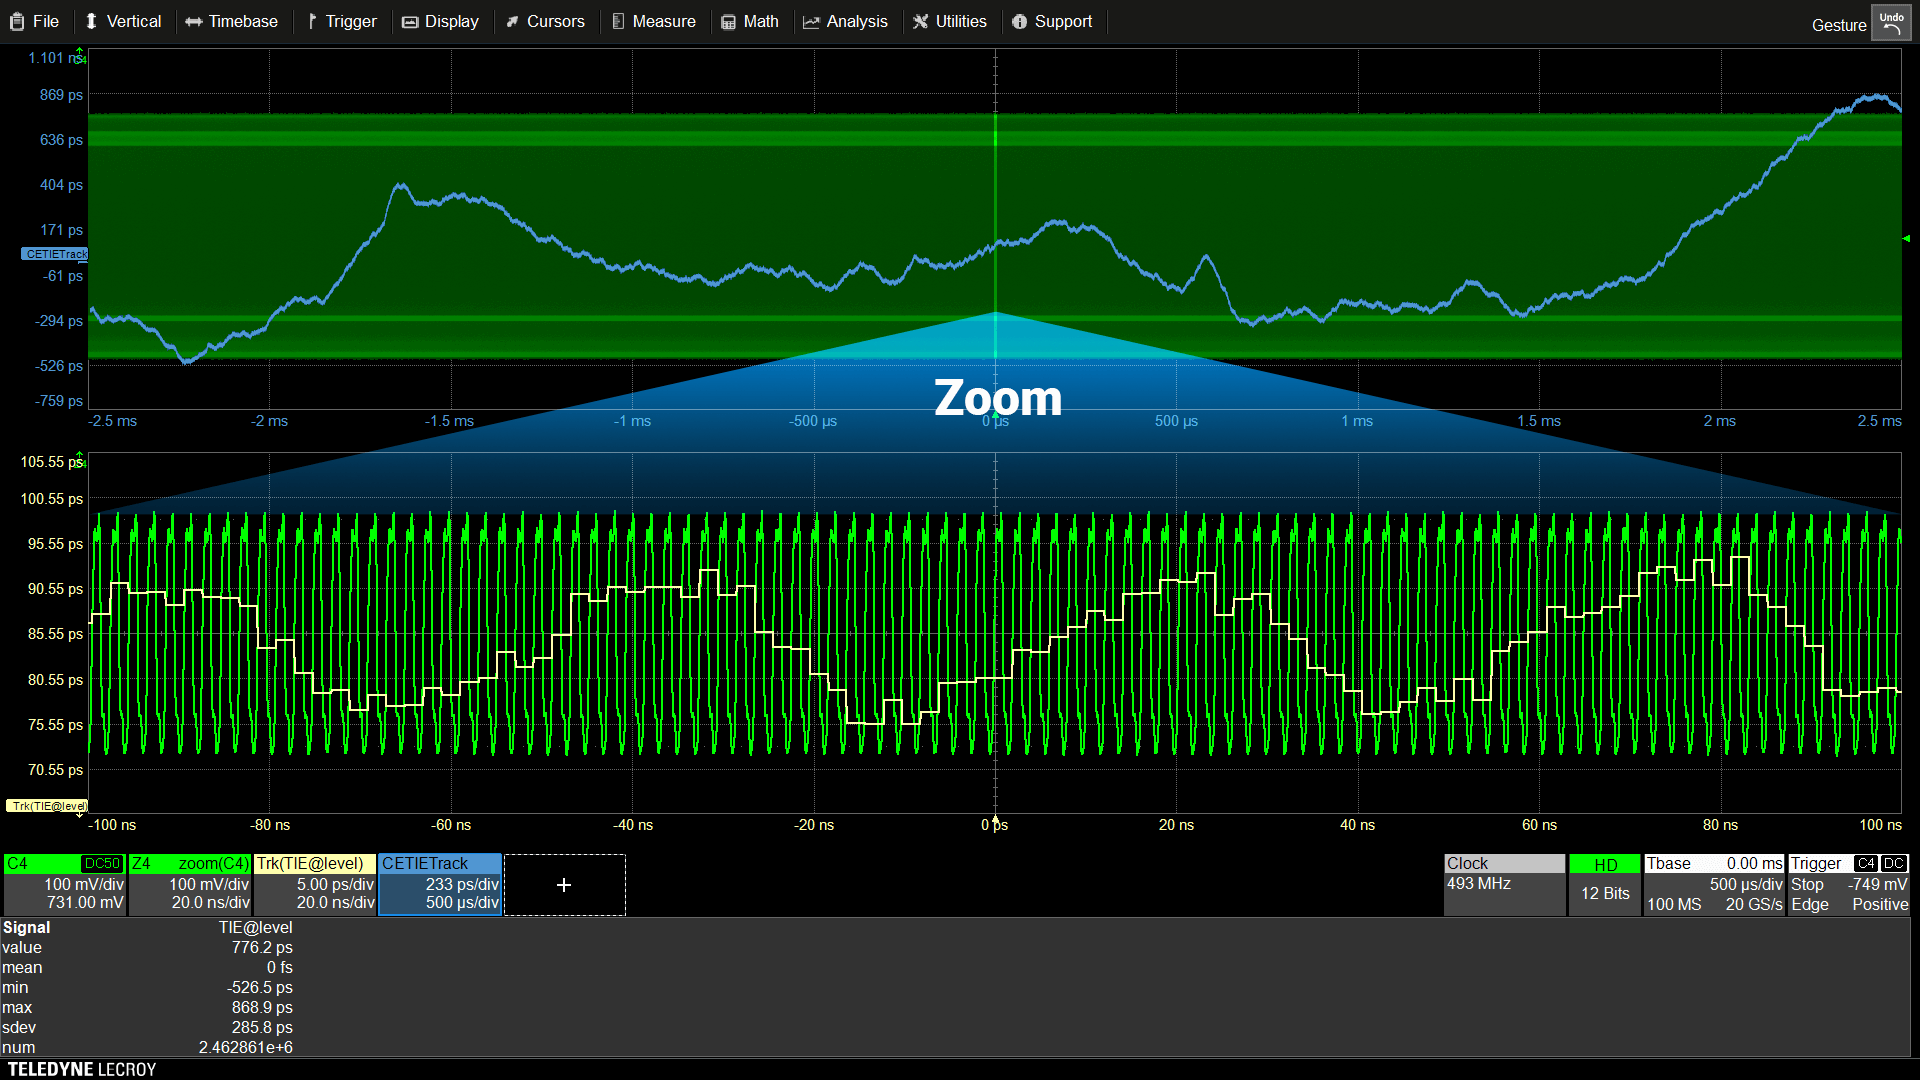
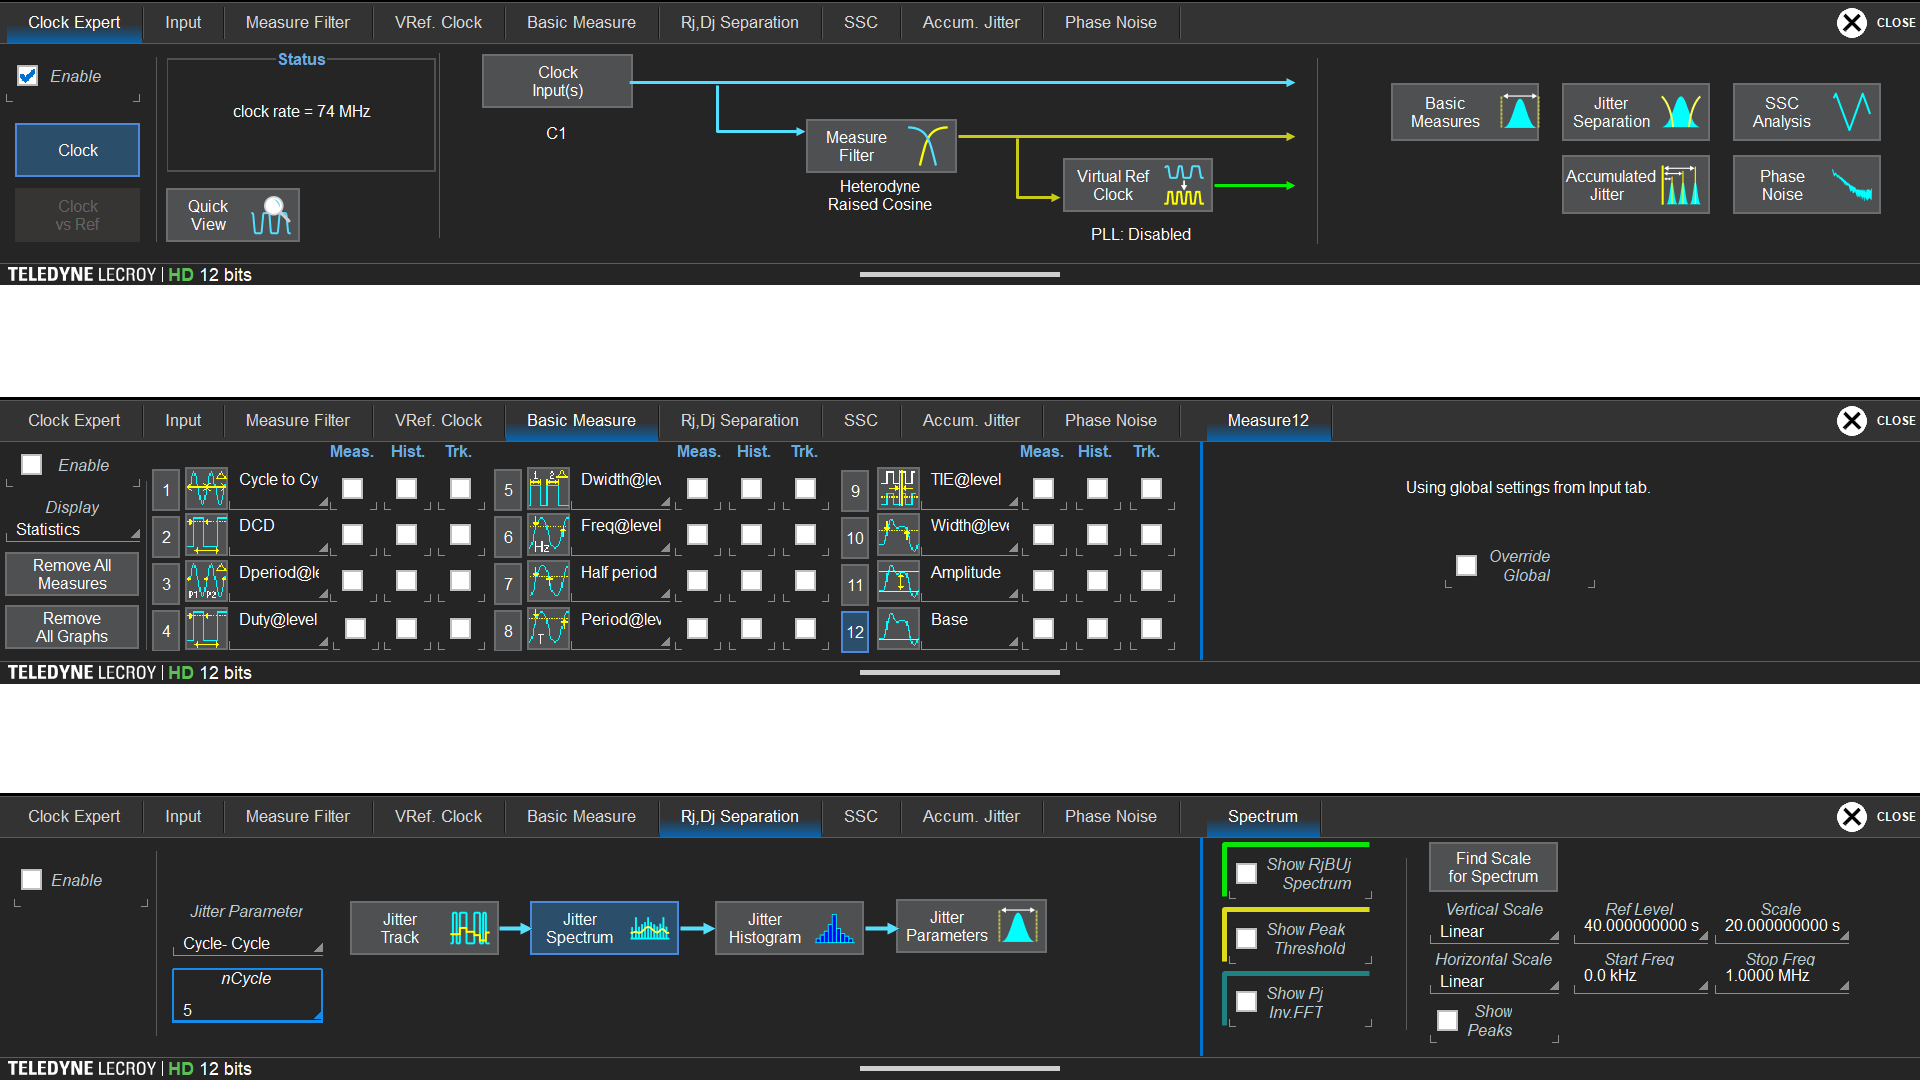
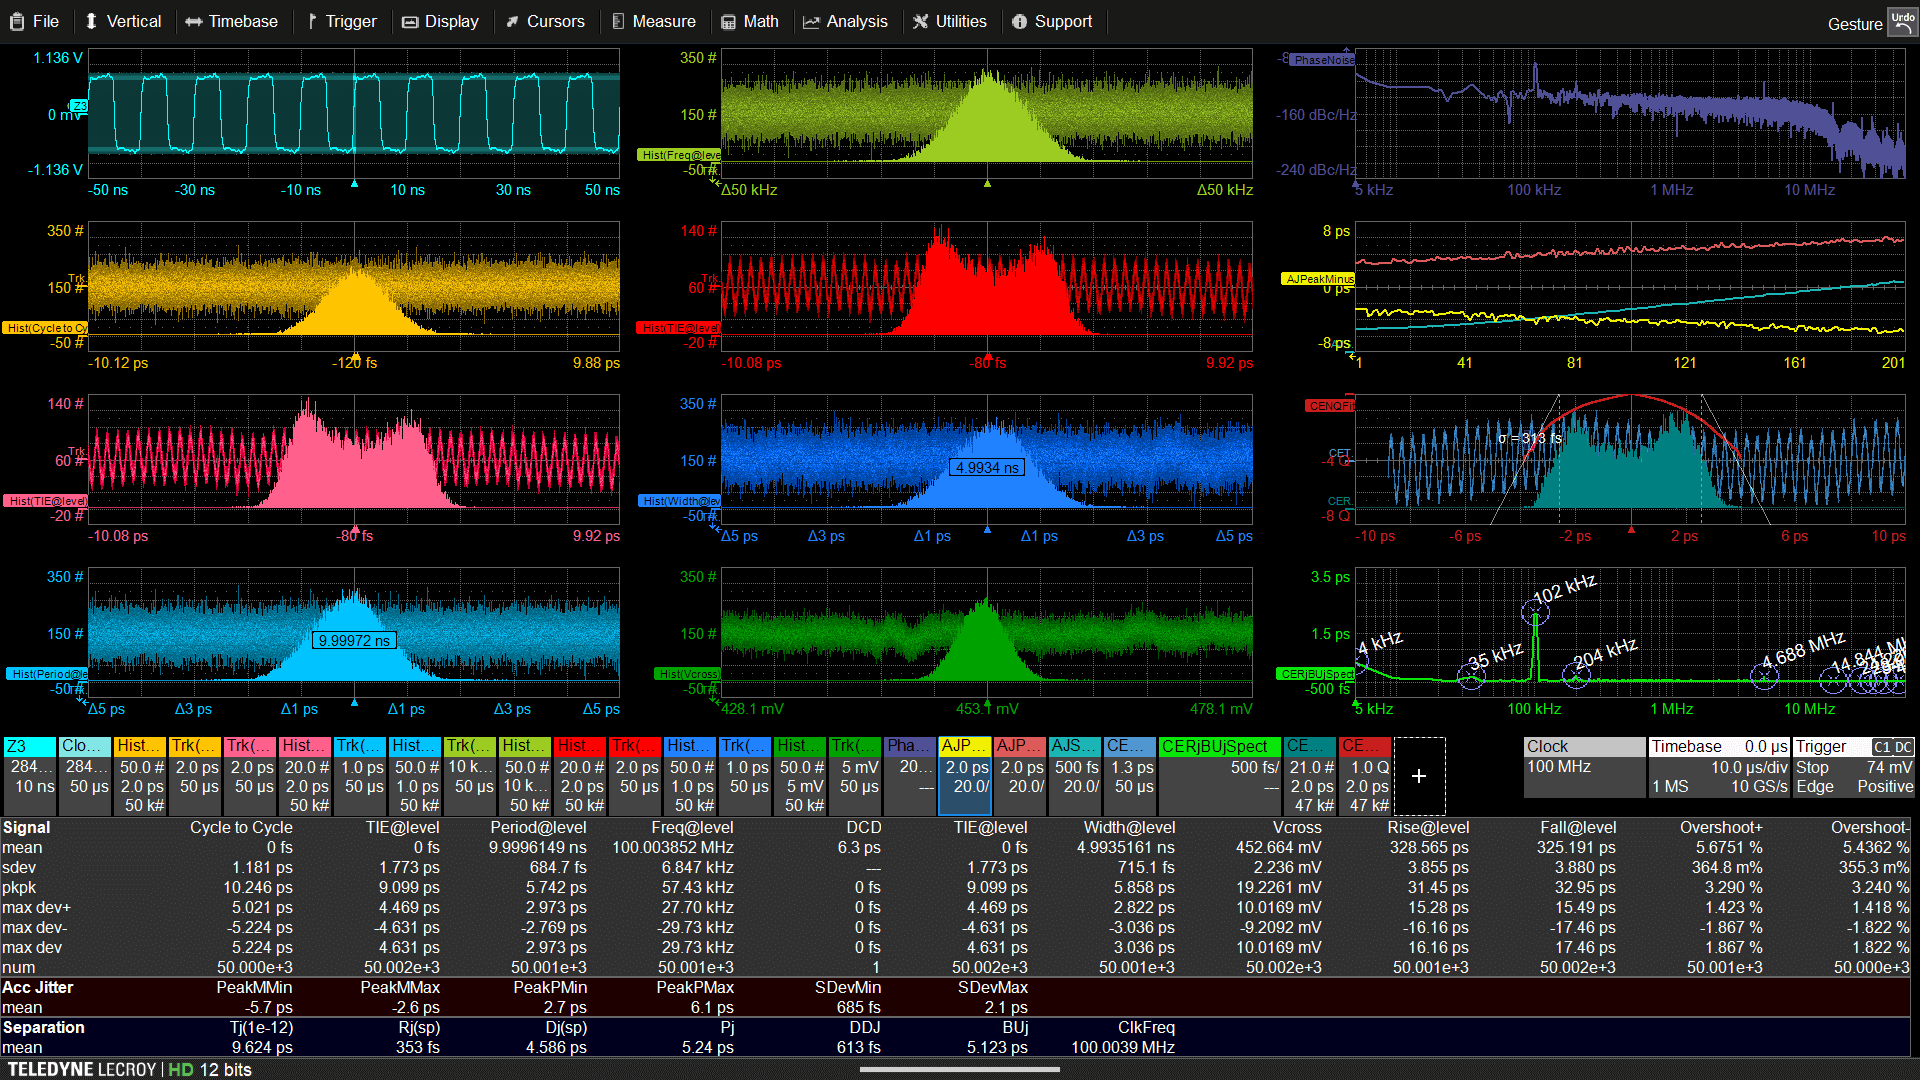
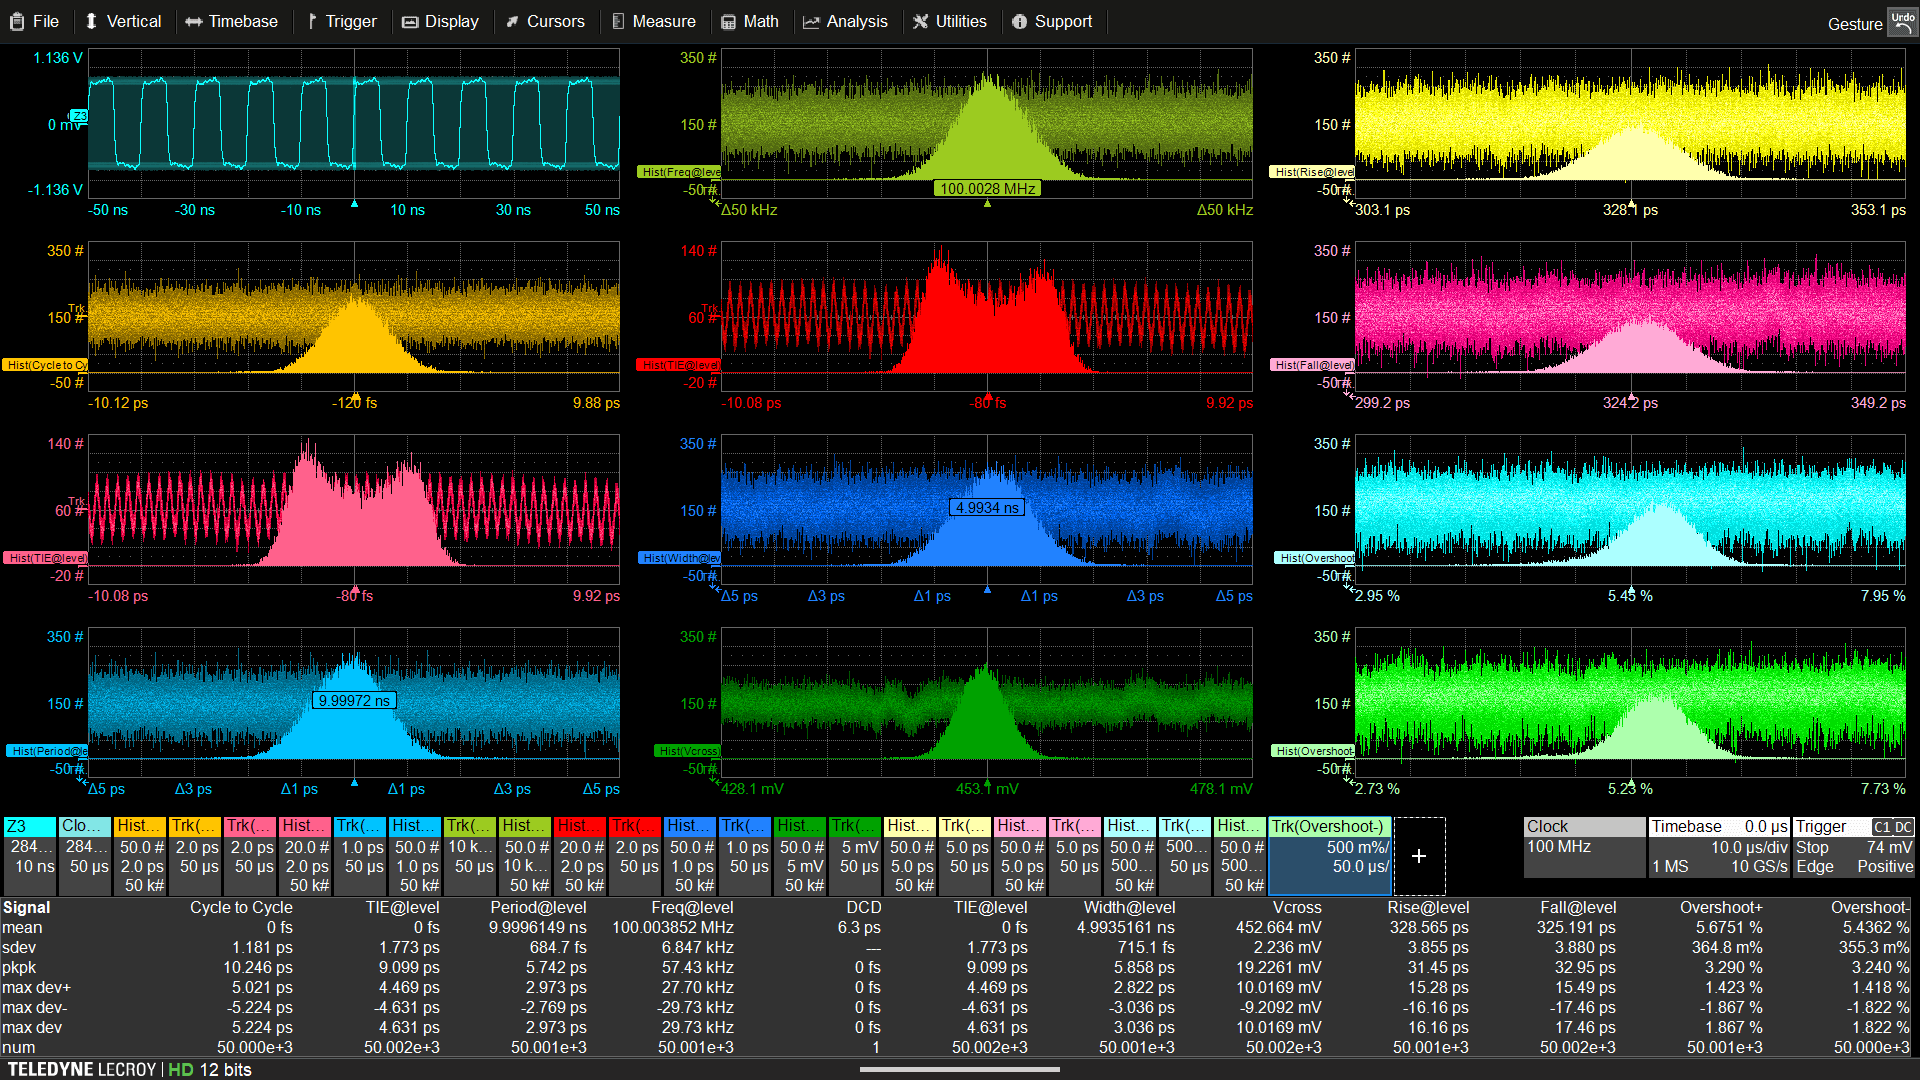
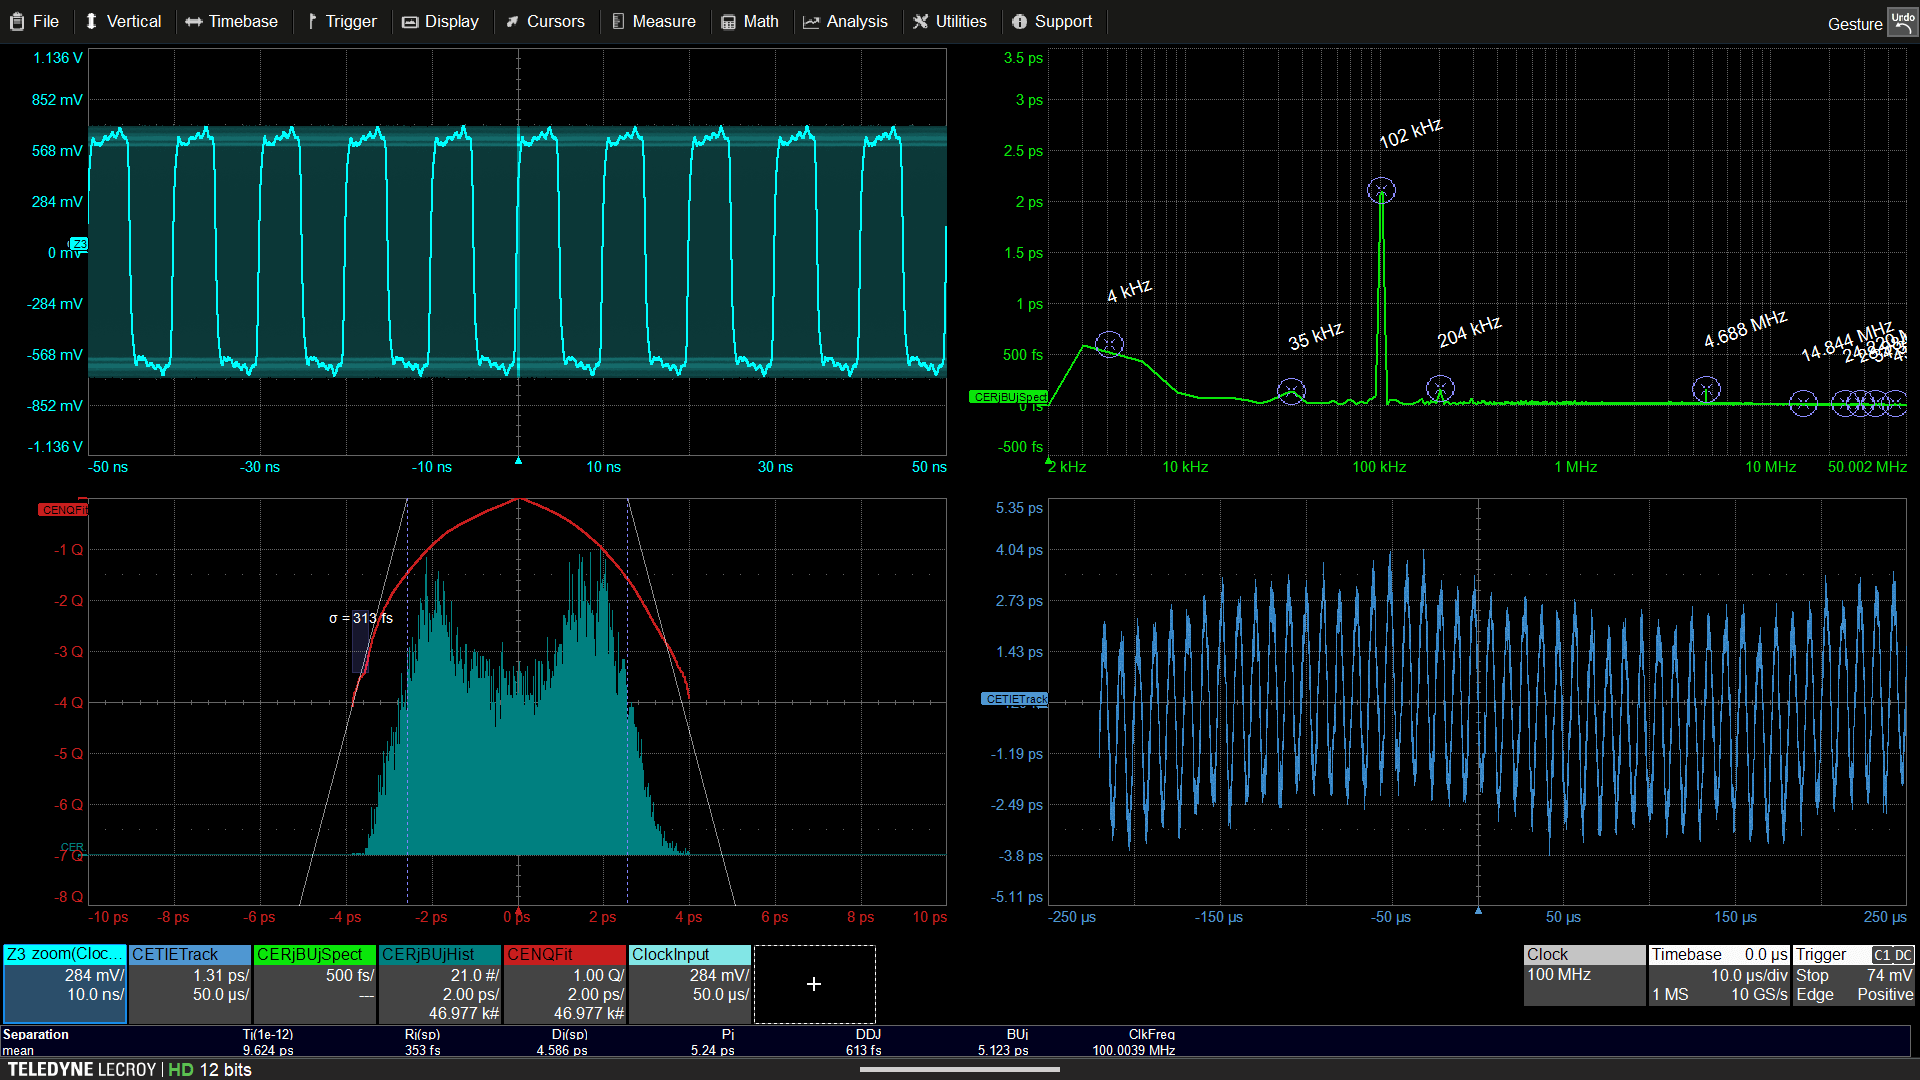
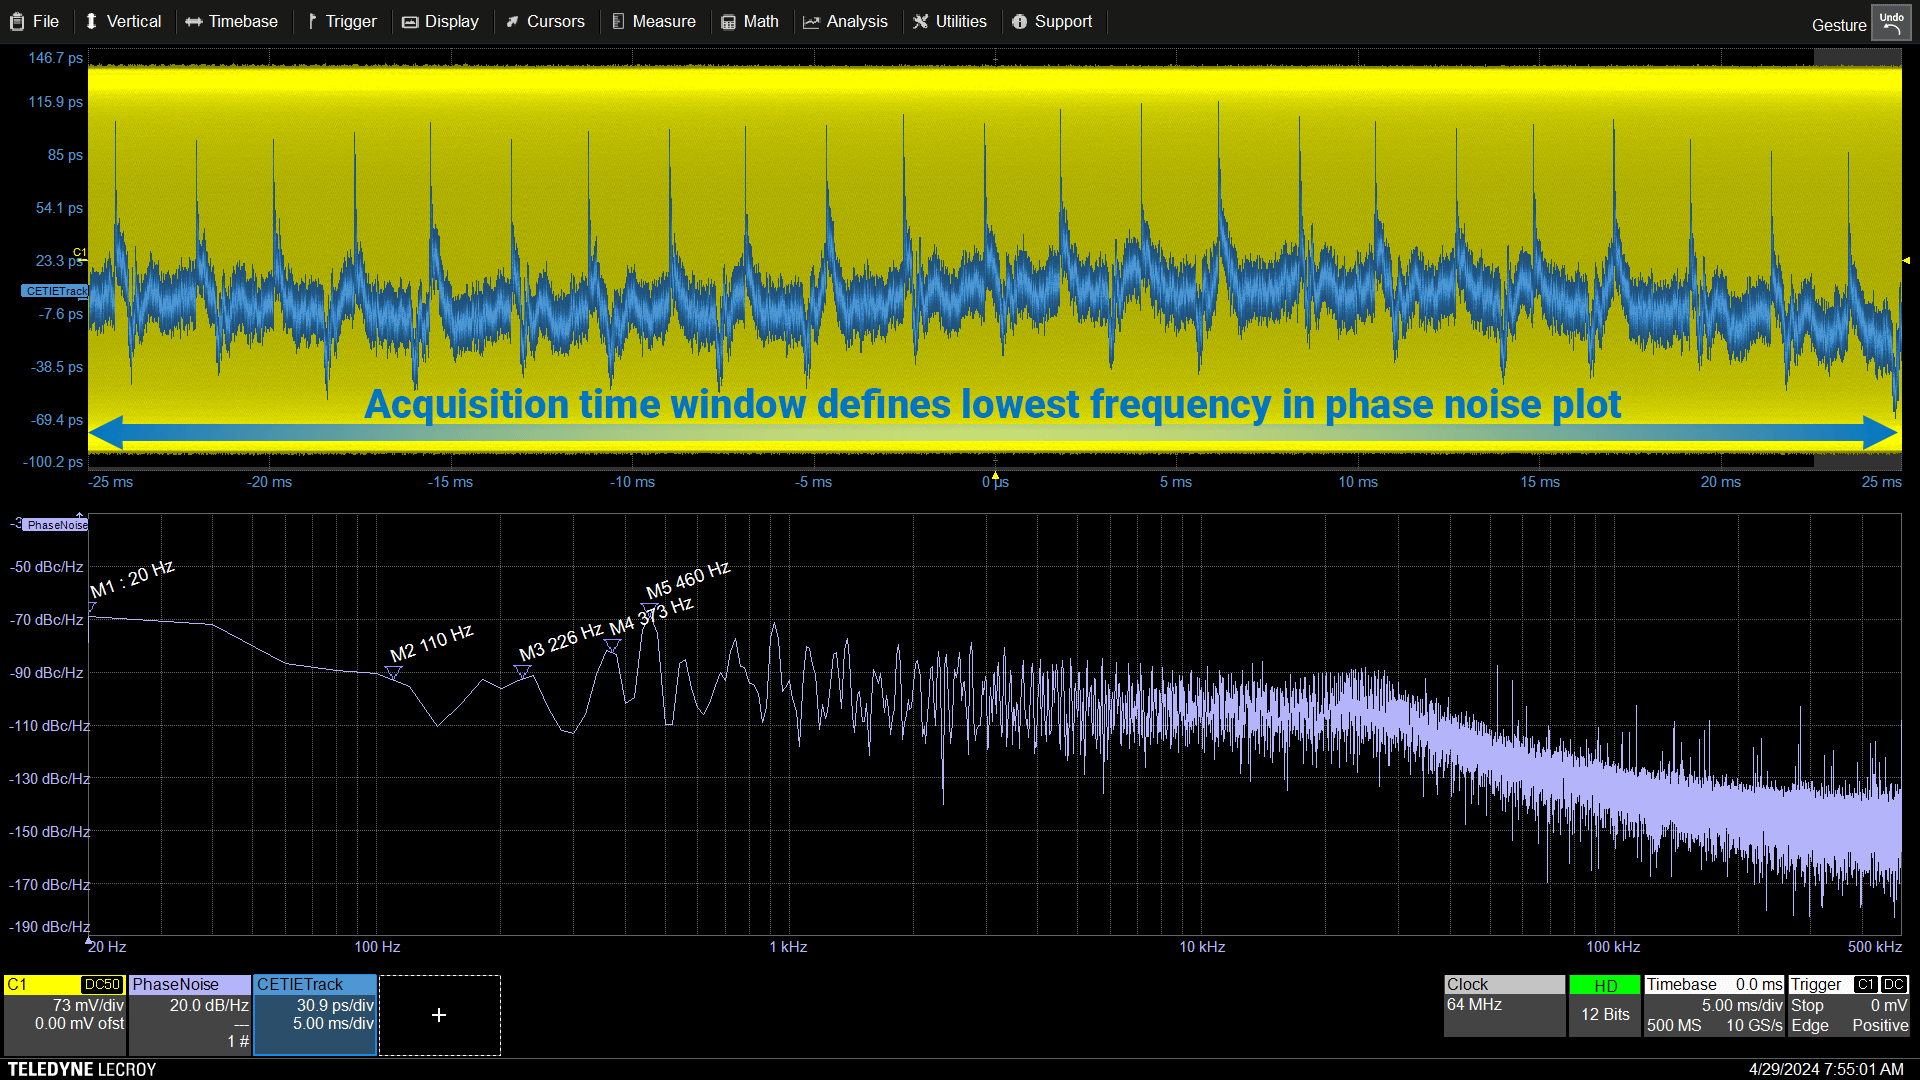
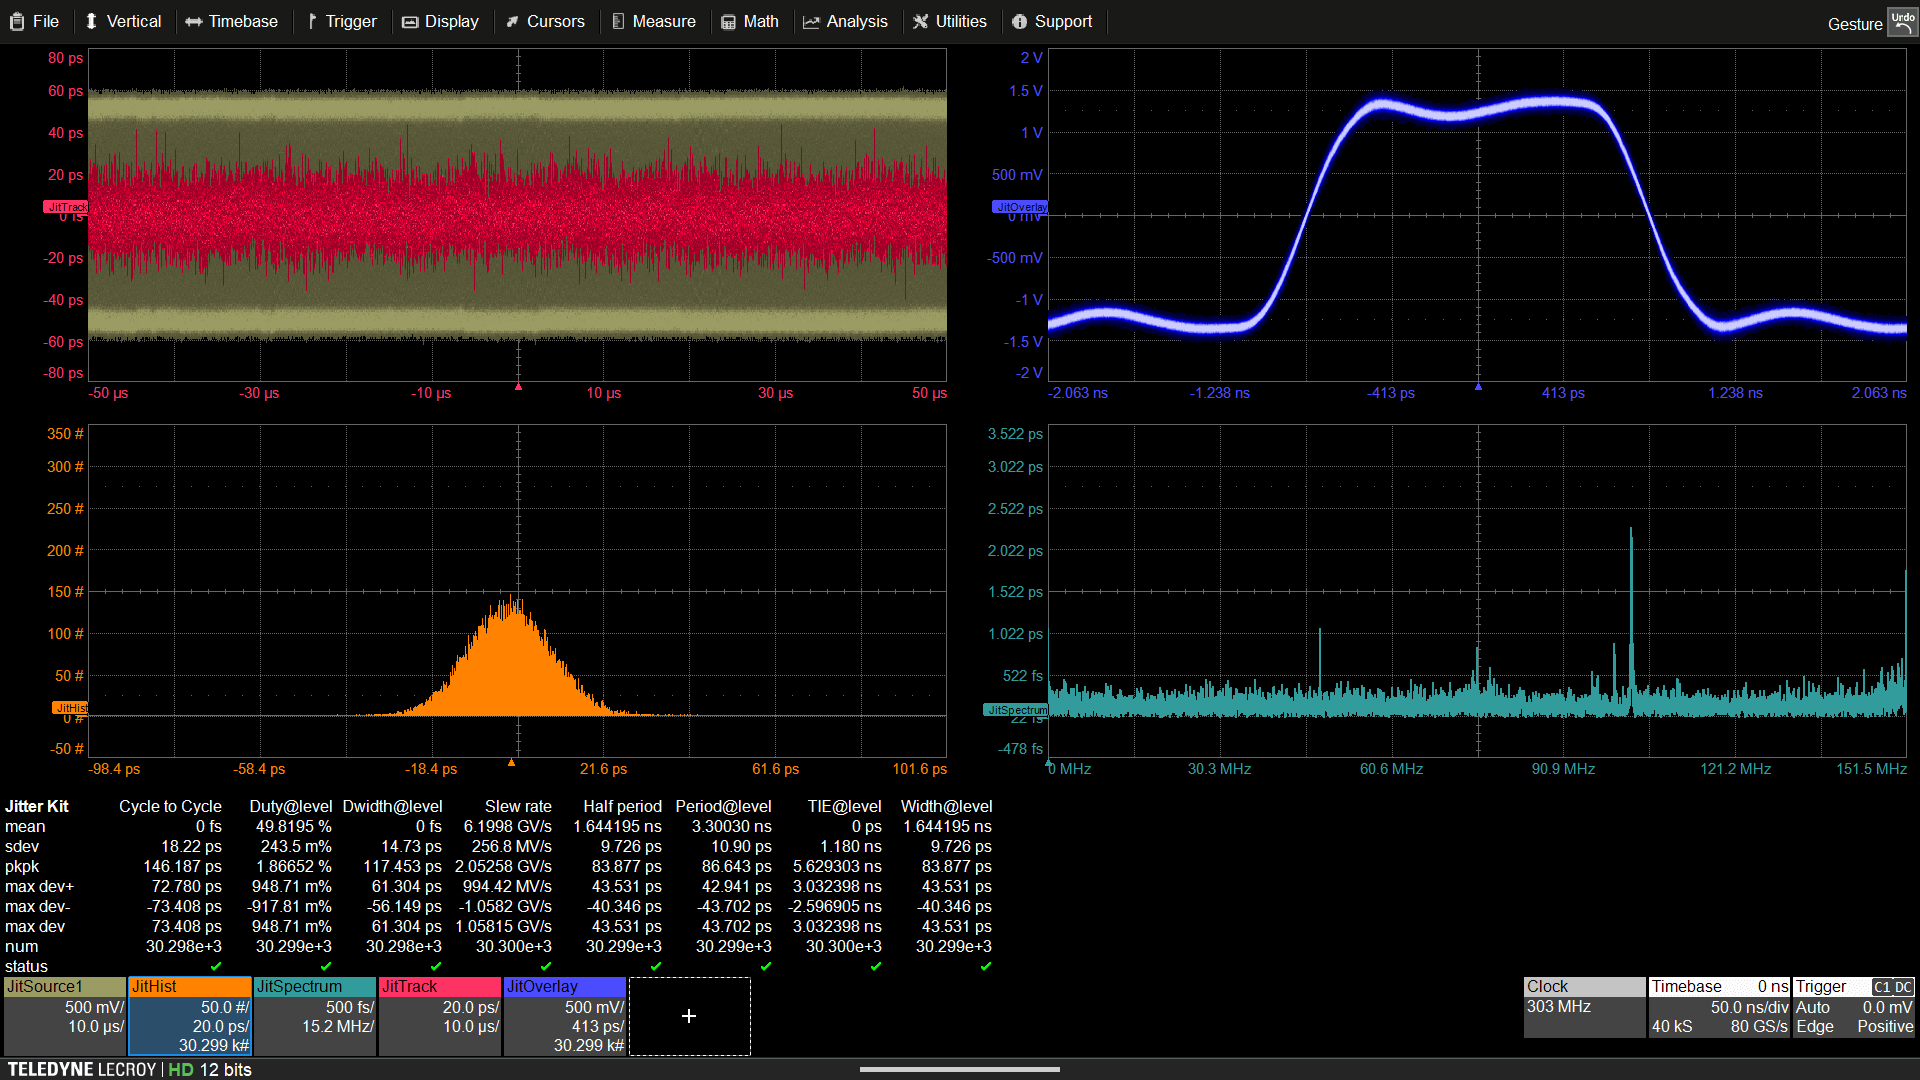
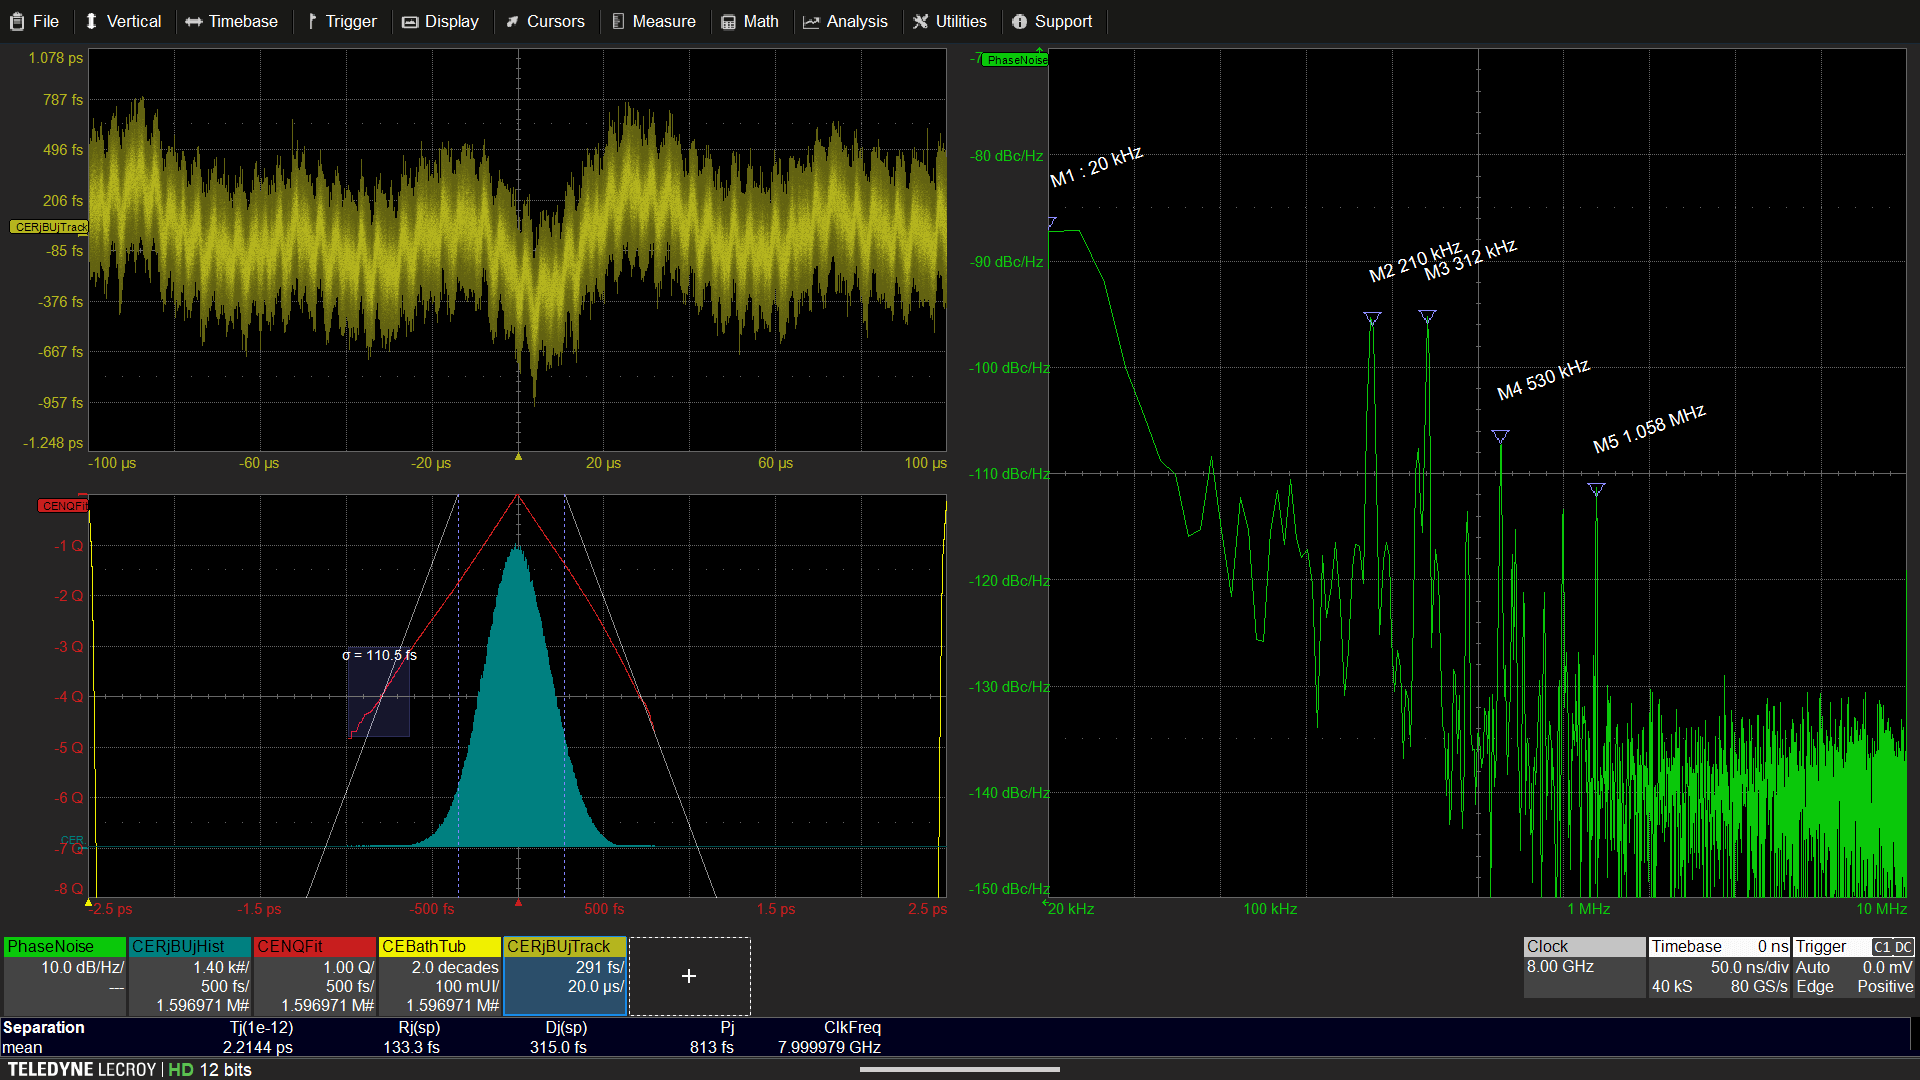
![]() 电路内时钟信号需要高度准确和稳定,以确保电路正常运行。必须了解并尽量减少时钟抖动、相位噪声和其他失真,以确保电路以其最大潜力运行。使用示波器进行的常见测量包括:
电路内时钟信号需要高度准确和稳定,以确保电路正常运行。必须了解并尽量减少时钟抖动、相位噪声和其他失真,以确保电路以其最大潜力运行。使用示波器进行的常见测量包括:
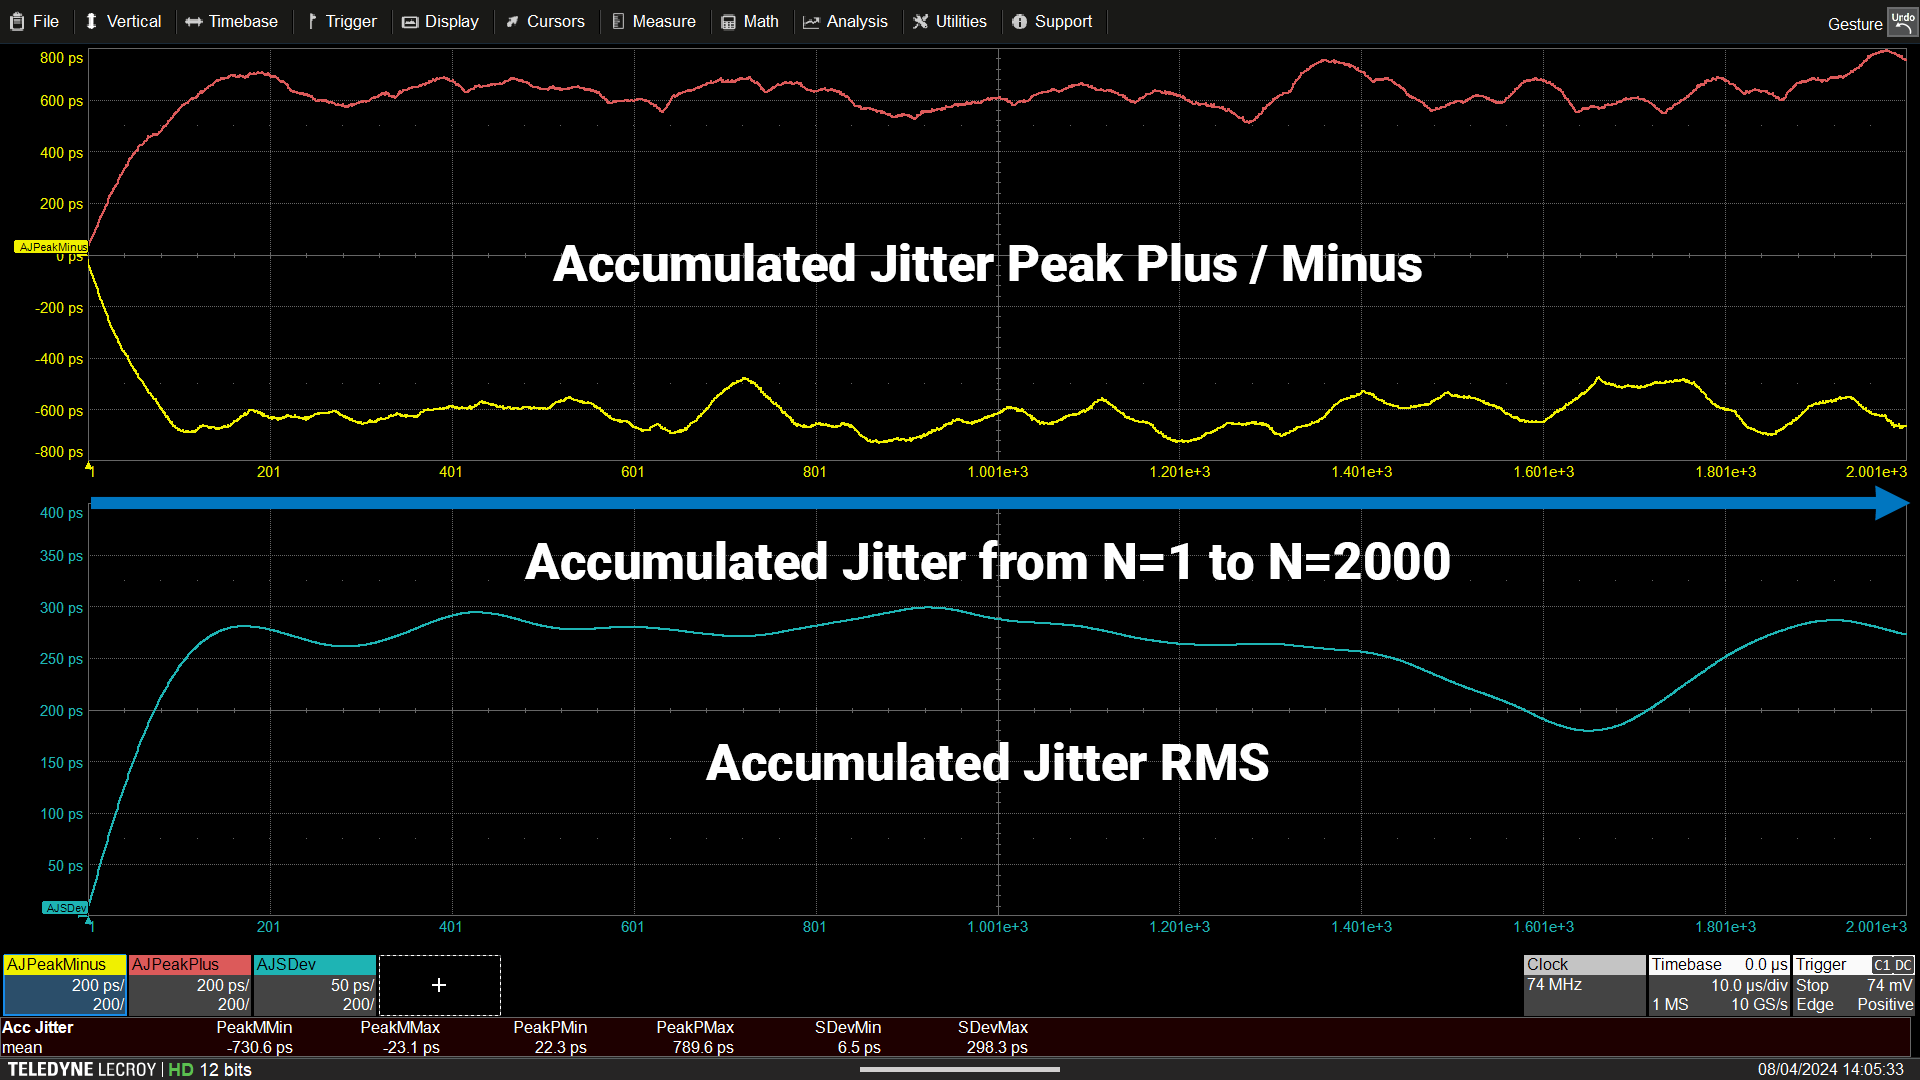
- 时钟抖动、n周期抖动、累积抖动
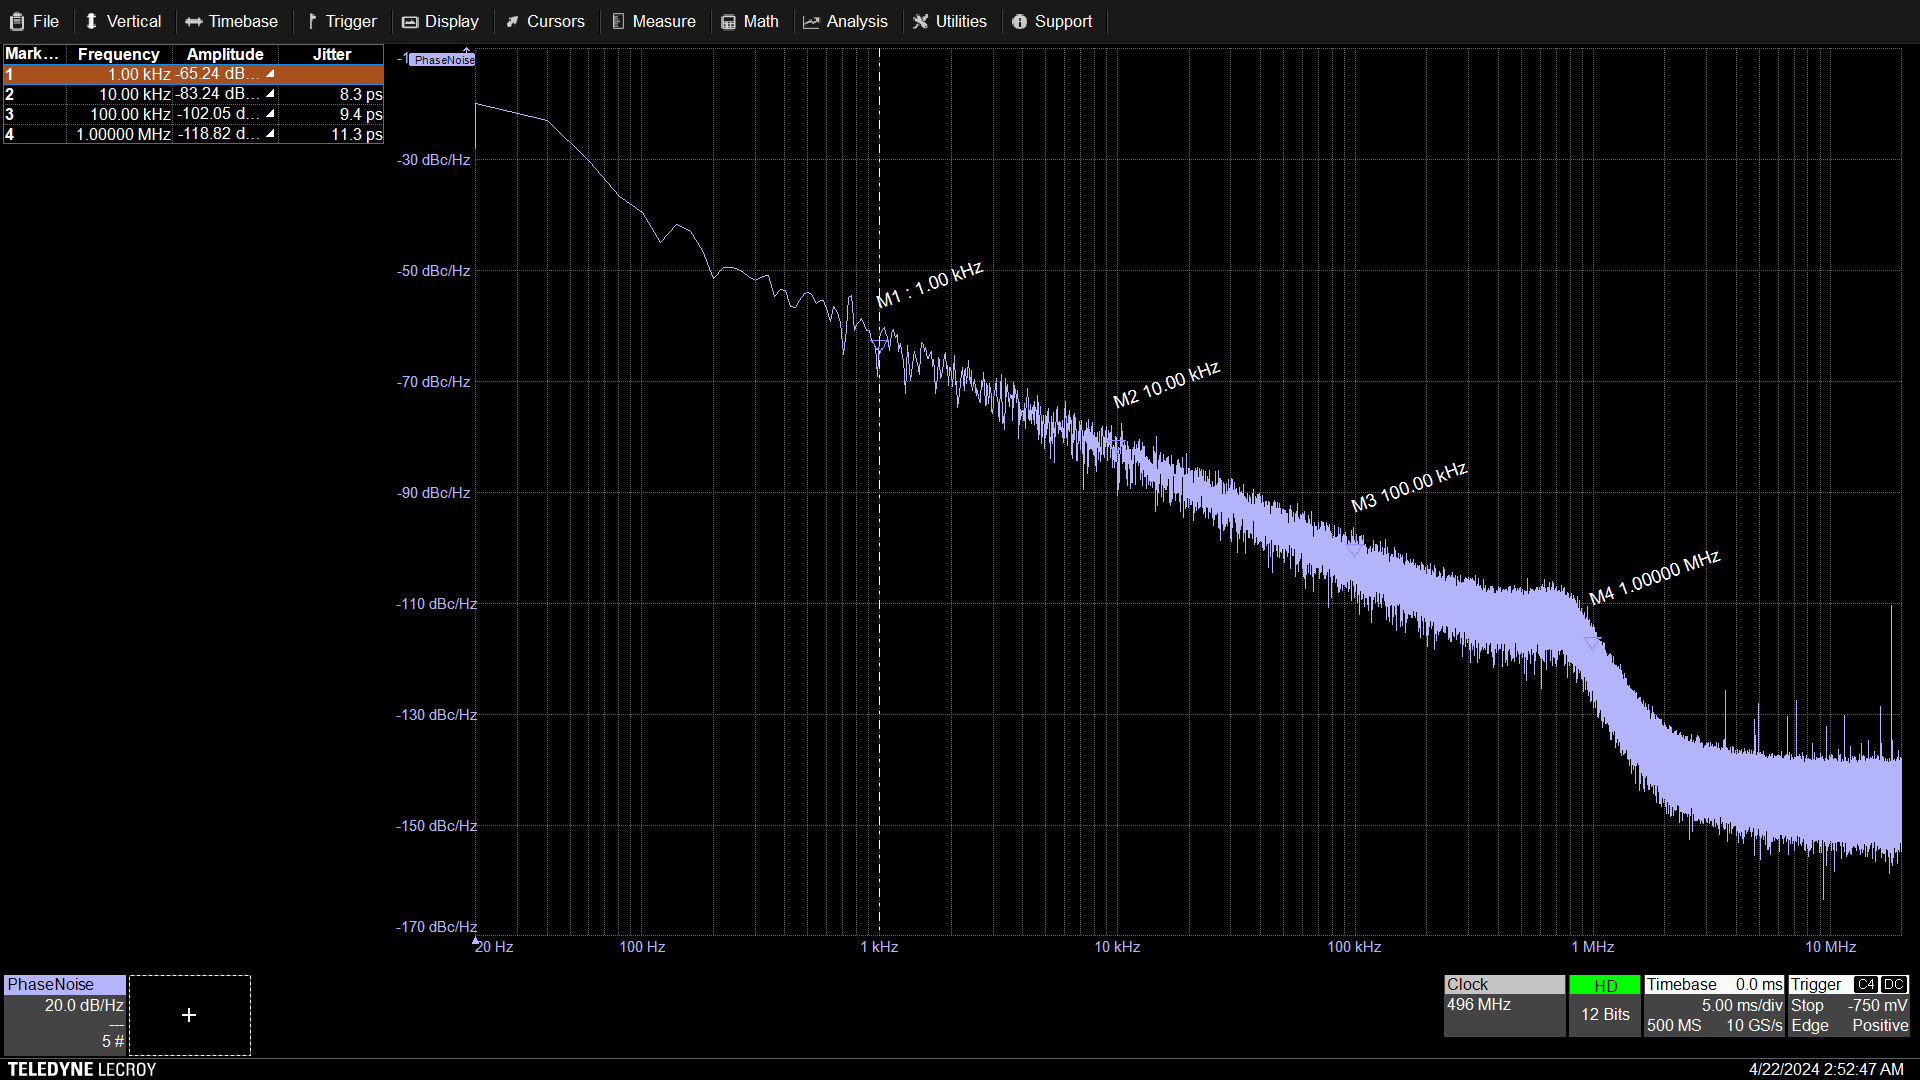
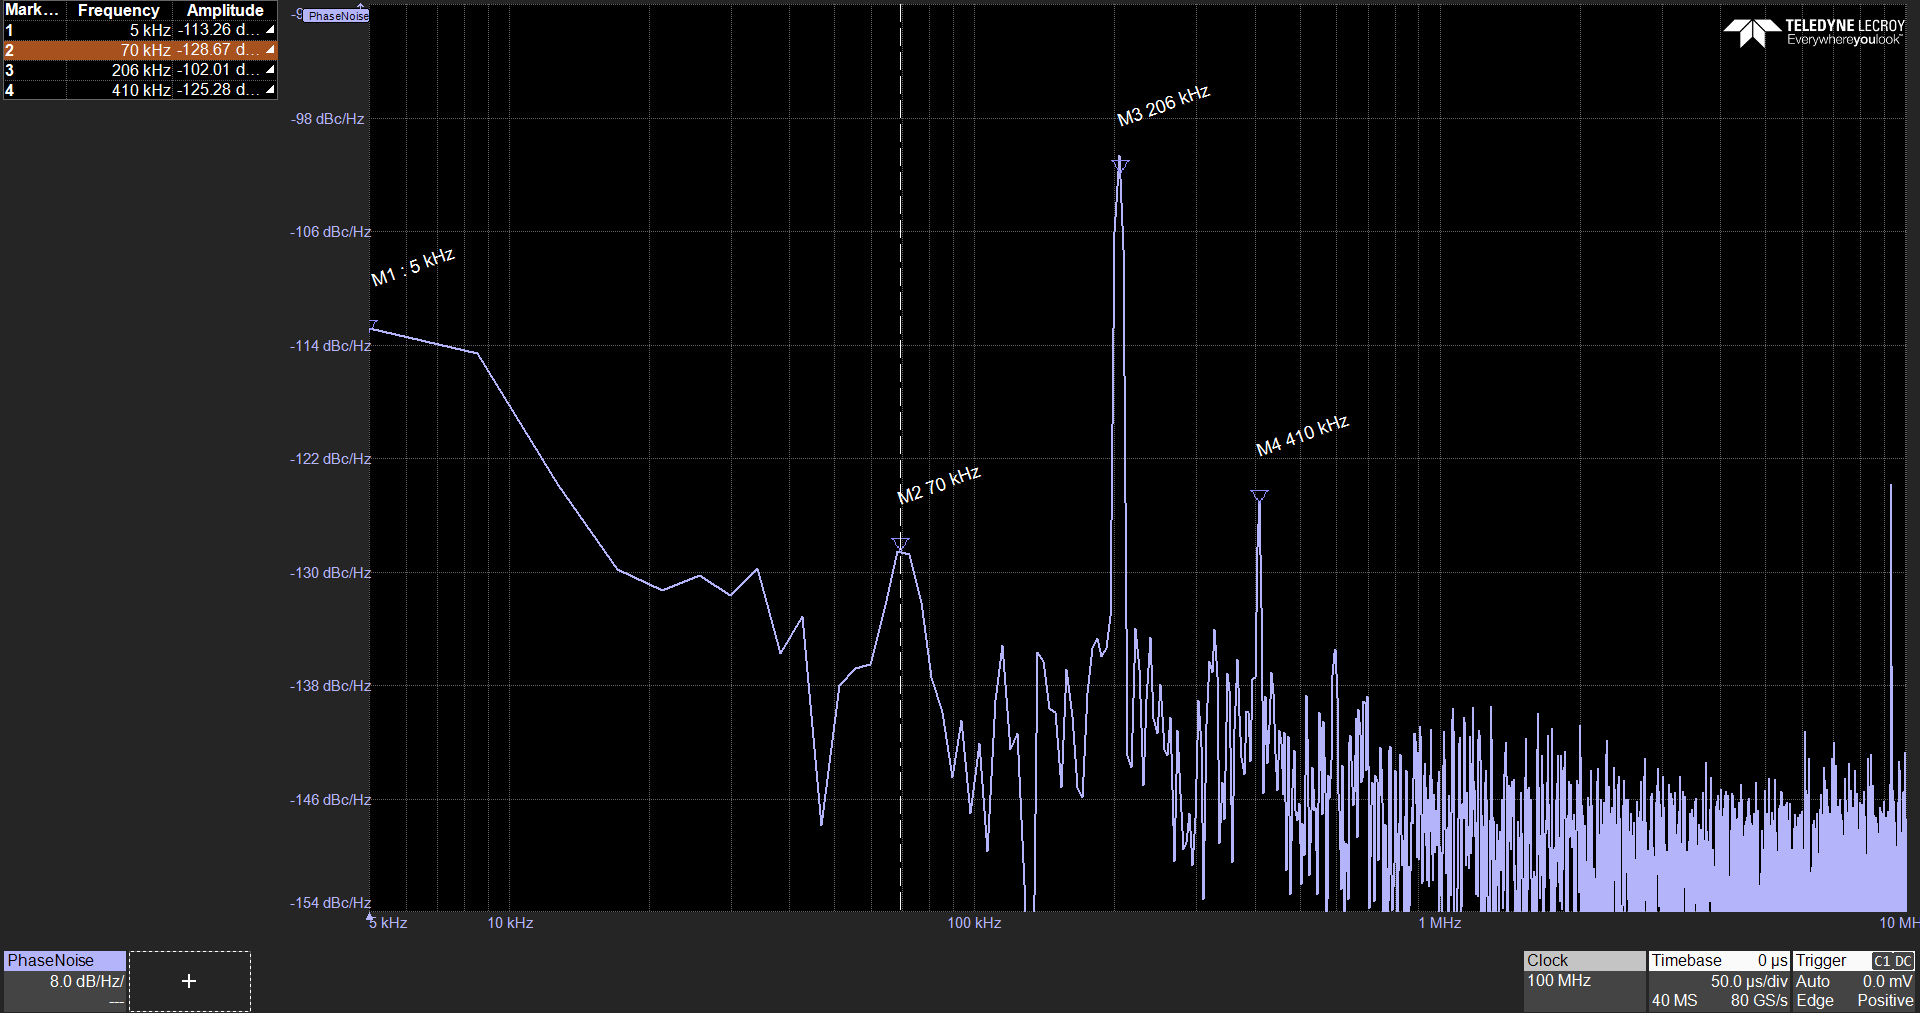
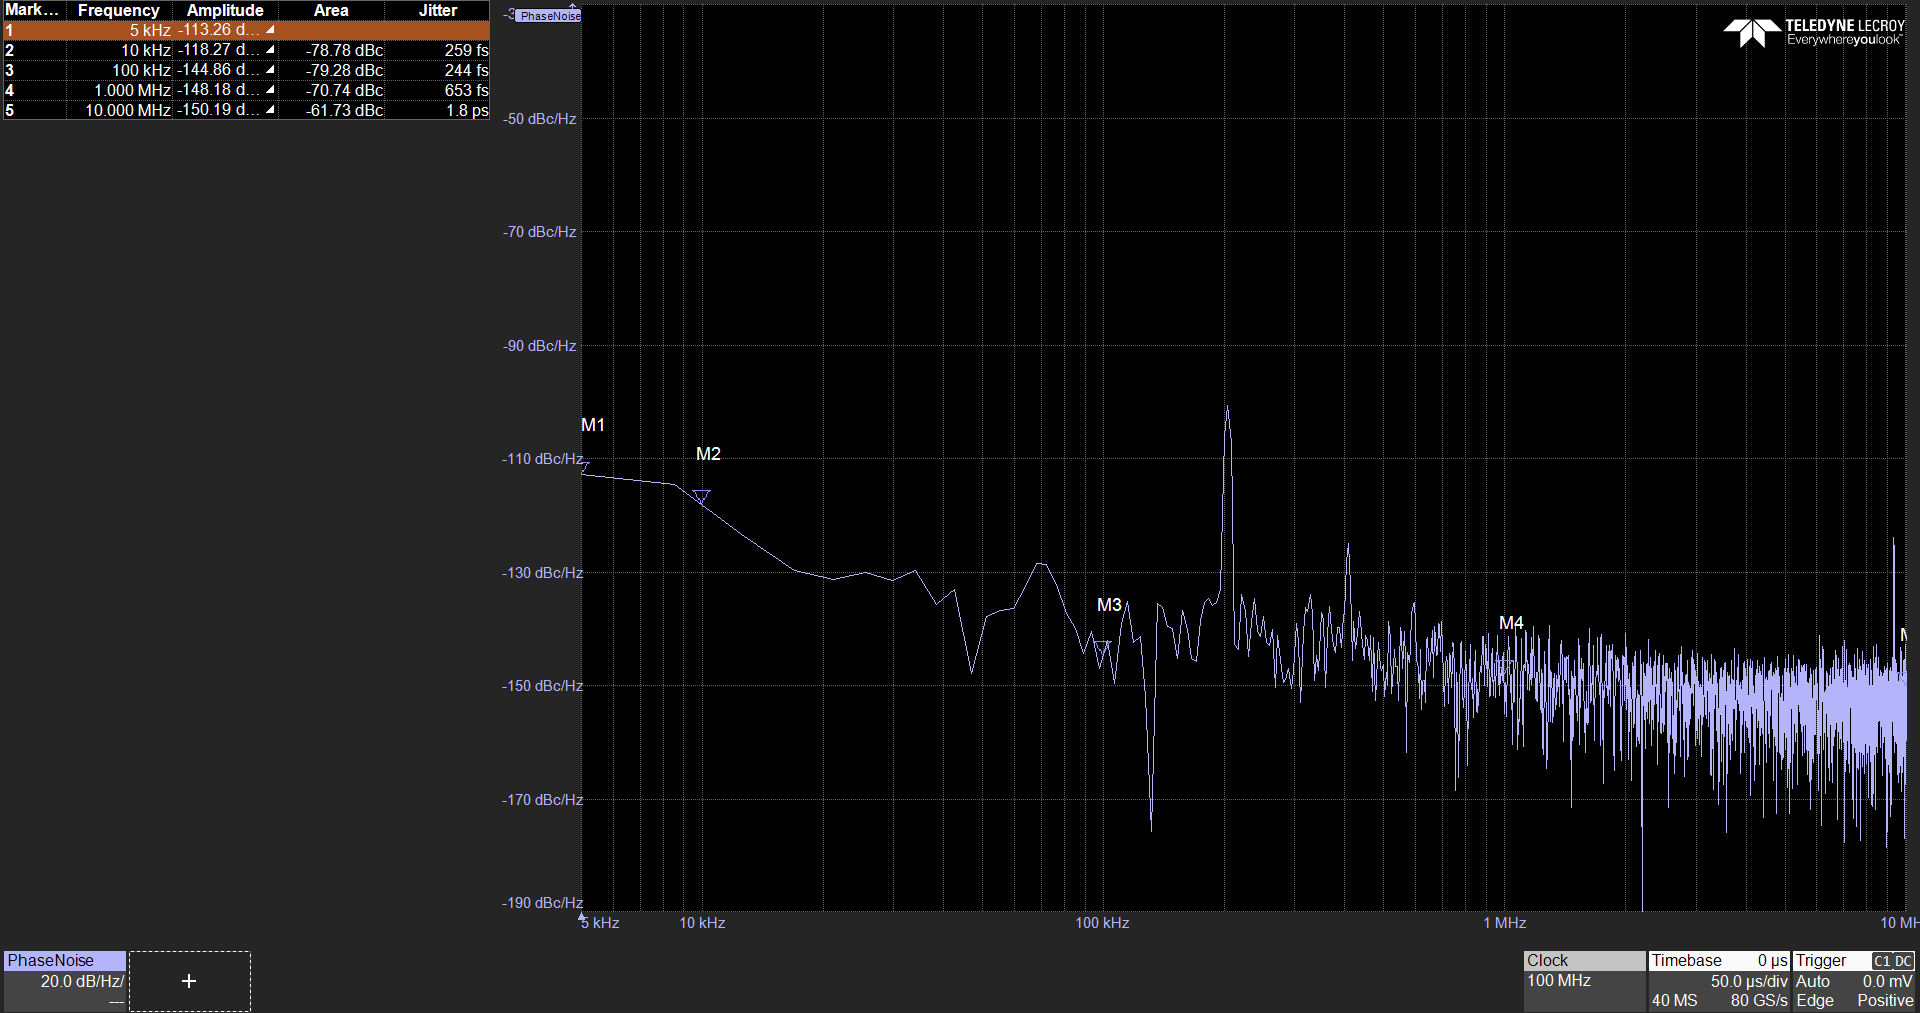
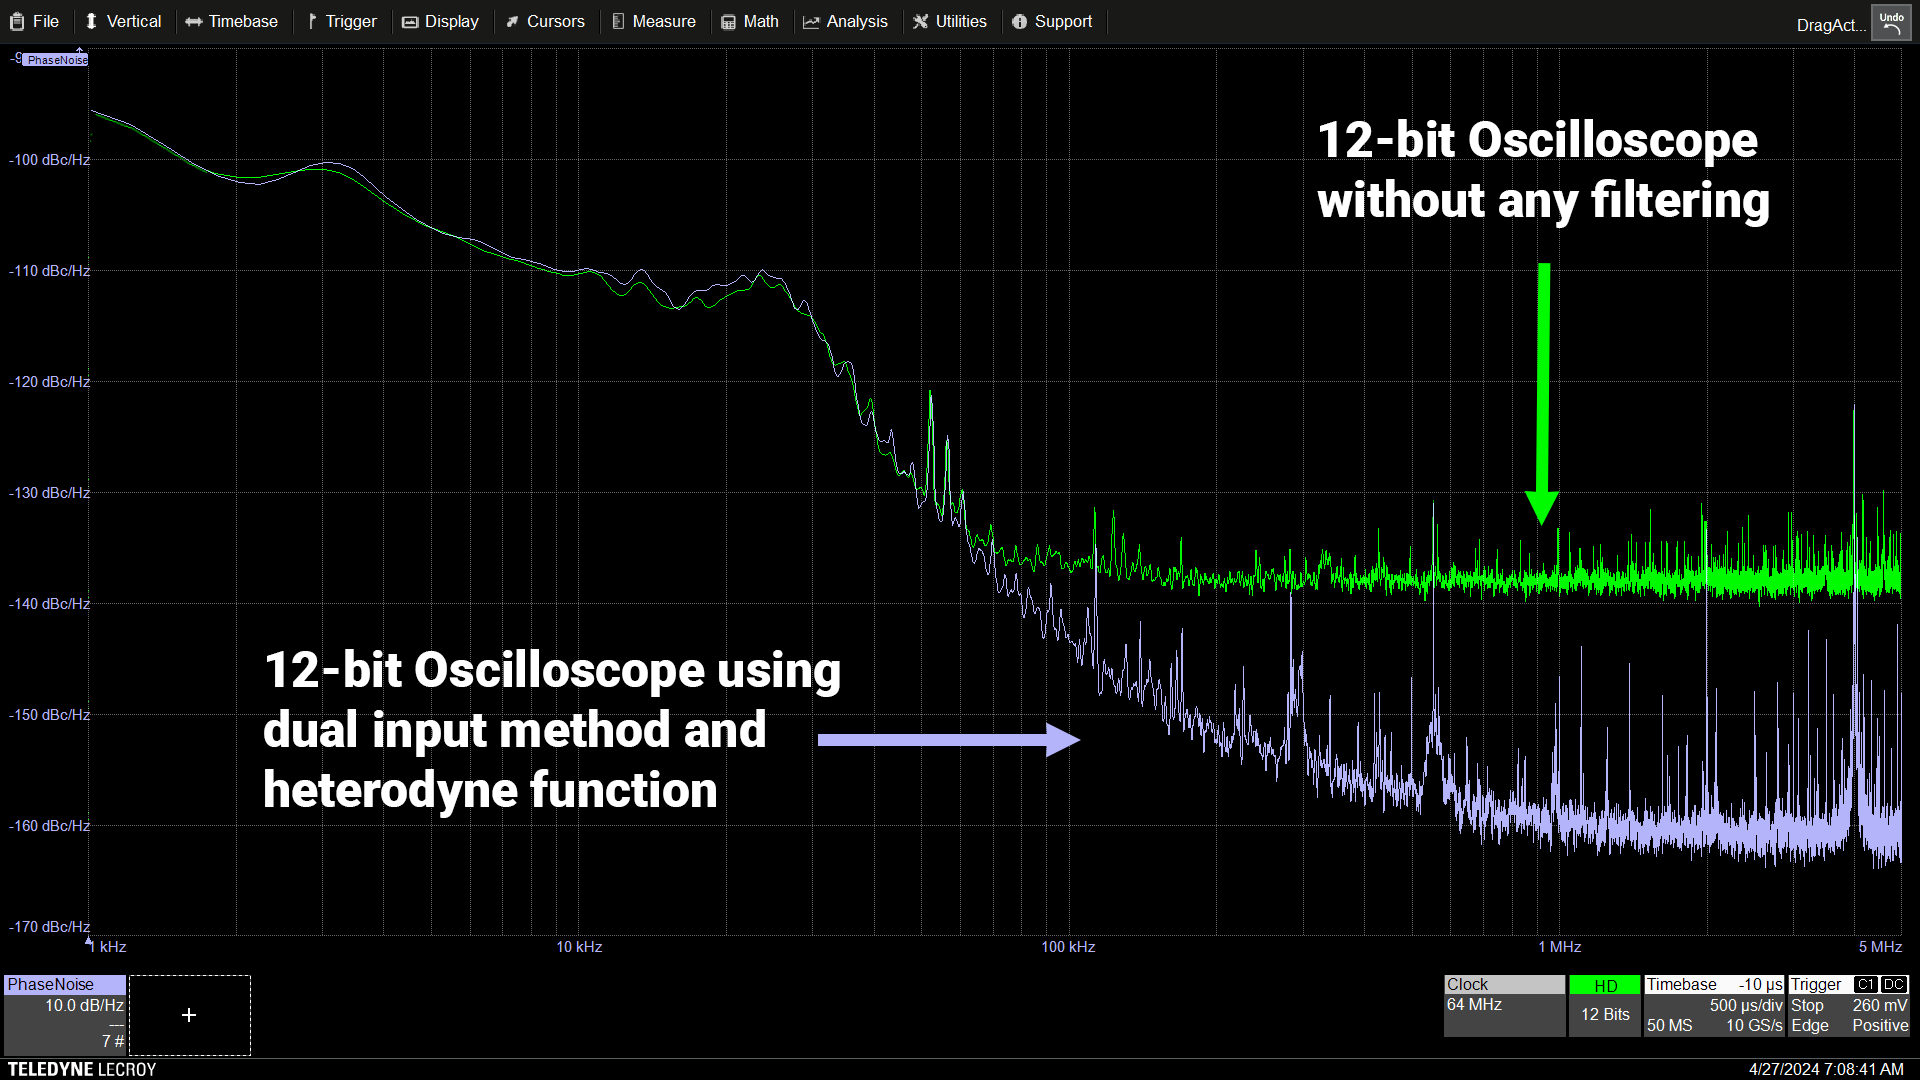
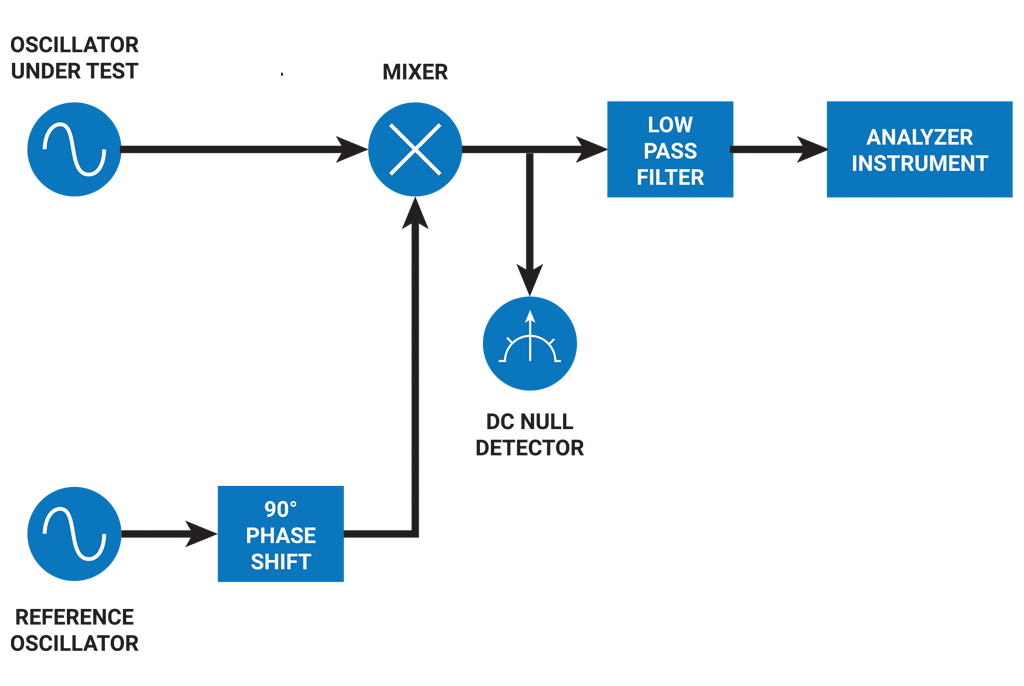
- 相位噪声测量、相位噪声与抖动相关性
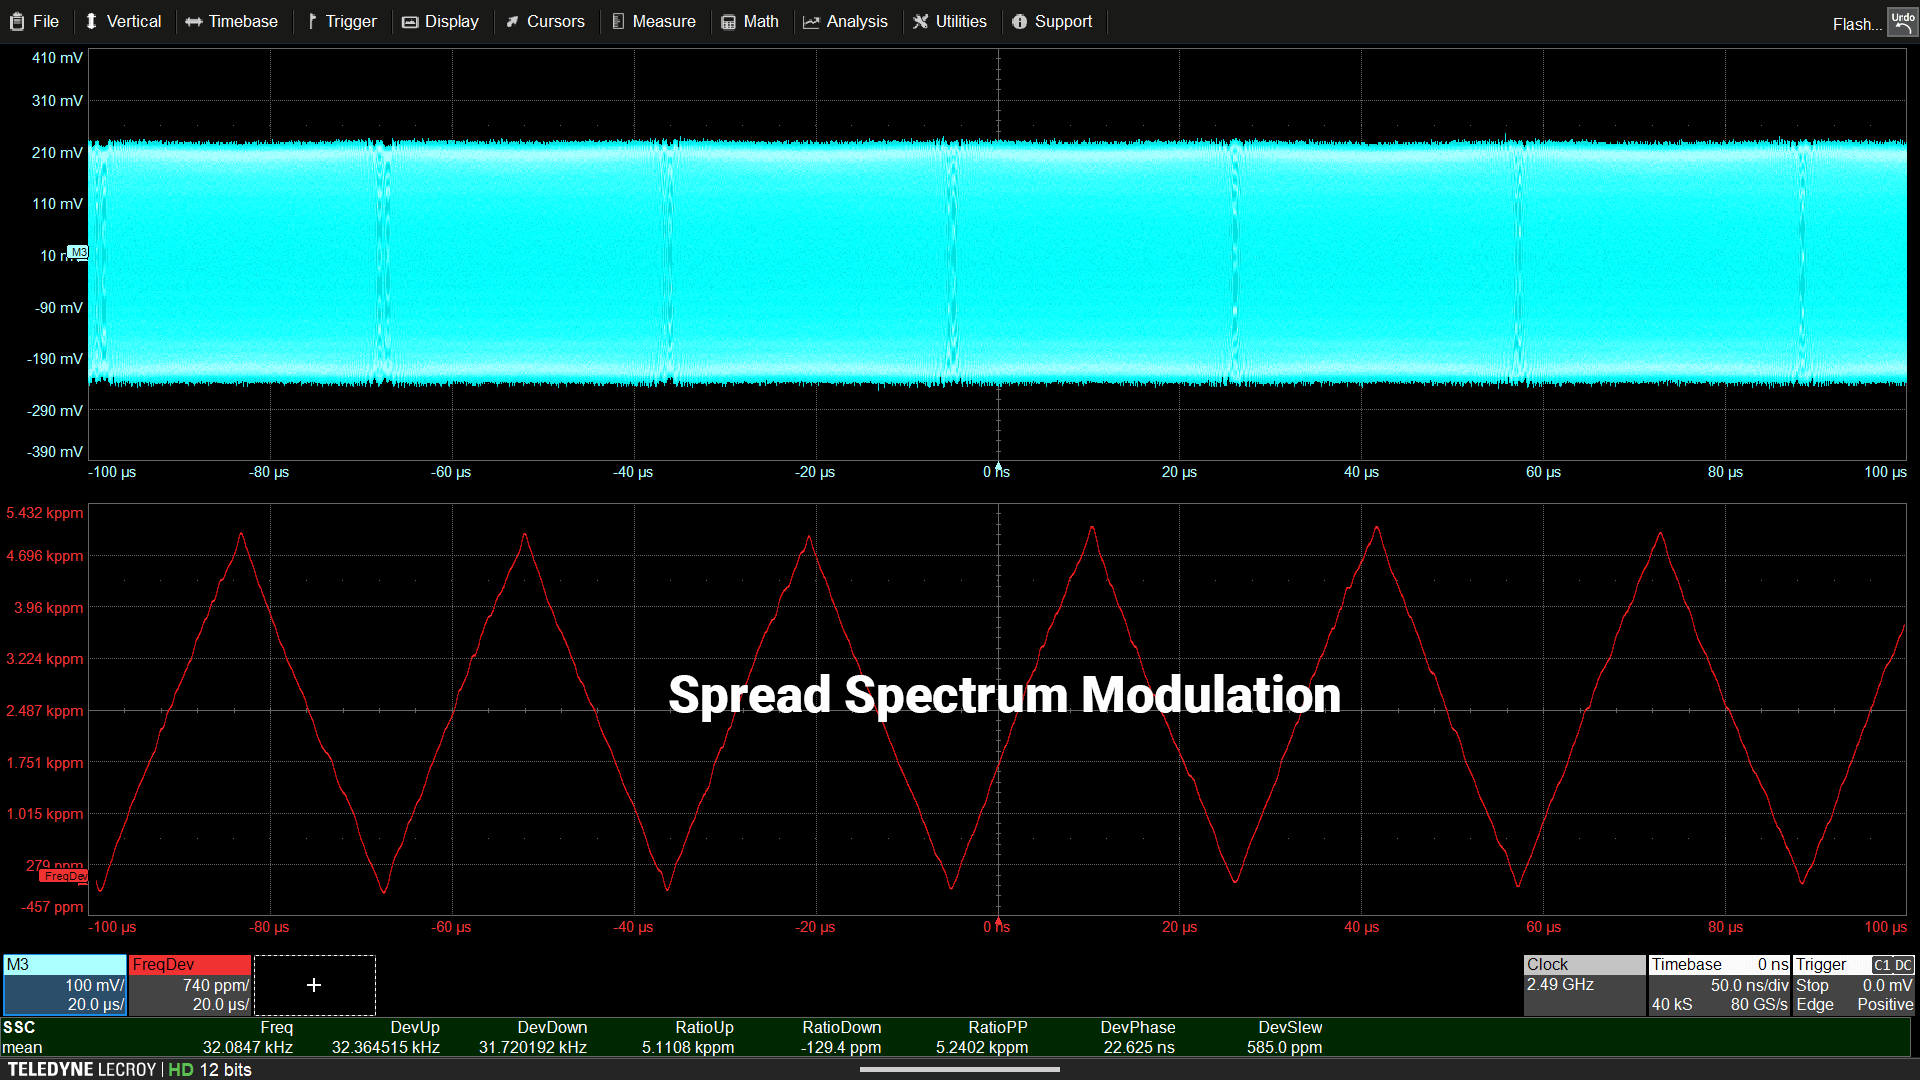
- 扩频时钟分析
- 低频抖动和漂移测量